This is a question that comes up very often in teams: should we estimate and count the technical debt in velocity? The answer is not so simple and as Scrum Master, all eyes can turn to you for a wise word.
The technical debt?
The technical debt represents all those things we did not want to -or could not- do.
 Développeur luttant contre la dette technique
For example, the Product Owner has accepted that stories are considered Done, even though not all acceptance criteria are validated, or all the criteria of the definition of done are not checked, or even that the code generates a minor bug.
- An anomaly is created when a feature does not match what the Product Owner has defined, as an invalid acceptance criteria
- A bug is a problem that is created by a code change, often outside its perimeter –by influence– while the code itself responds perfectly to the functionality and acceptance criteria
All these things will have to be done one day. The team is saving time today, to pay for it later. You create technical debt.
Count technical debt in velocity
Some teams estimate and take into account this debt in their velocity. For example, if the average velocity is 30 points per Sprint, and the team agrees to absorb the equivalent of 10 points of debt, then they will have to split the remaining 20 points in the functional stories.
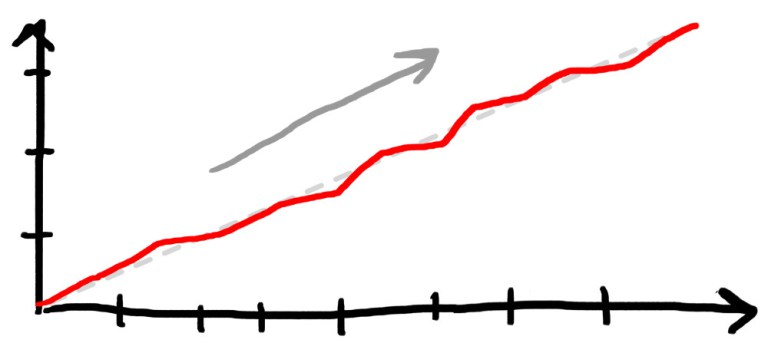 La vélocité de l’équipe
The good velocity, and the bad one
If the velocity remains constant, the functional value added to the product decreases. It is therefore important to keep a way to differentiate the two. Like cholesterol, it seems that there is a good one, and a bad one; that’s the same here, so you have to watch yourself. You can take advantage of the BurnUp chart to reveal the difference between the two.
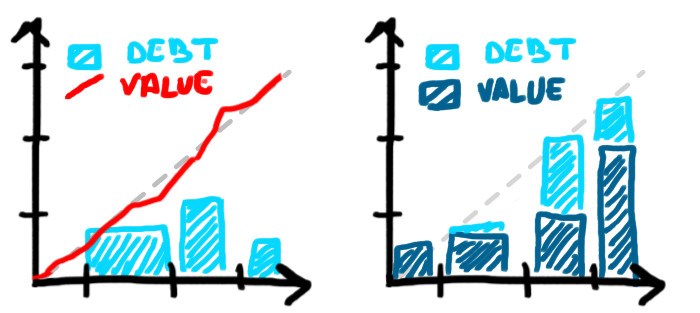 Visualiser la dette contenue dans la vélocité / Répartition de la dette dans la vélocité
Here, although the velocity remains constant, the technical is visible and provides information.
Do not count technical debt in velocity
In contrast, it is possible not to count technical debt. The definite advantage is the quick and immediate illumination of its impact –paradoxically.
1/ The debt is not estimated
This case is tricky. Although the velocity drop will be visible and you can still add a note to the BurnUp, the Product Owner will not be able to project on the impact of the reimbursement and so, will have reluctance to prioritize it in the dark.
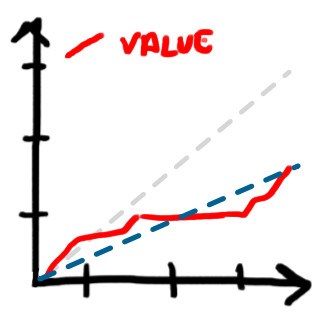 Chute de vélocité, incompréhensible
You can see here a dramatic drop in the velocity (blue dots). Almost nothing (valuable for the user) has been delivered for a time –the flat part of the red line– but the reason is not visible.
2/ The debt is still estimated
It is important to show why the velocity dropped. If you have estimated the debt without counting it in velocity, you can use the BurnUp seen before but with, this time, the velocity line. This is the method I recommend.
 Il est simple de faire le rapport avec la dette
Estimate and show
The Product Owner must be able to have a vision of the amount of debt in progress to:
- accept or refuse a new debt in full knowledge
- measure the quality of the actual product
- know what quantity of debt s·he must forecast in the next Sprint
- forecast the time to pay it off
- understand the team
Visualization example
A Lego© baseplate on the wall. Color and size of elements could be in relation with the type of element (a big red bug, a small yellow story, an average blue technical task …).
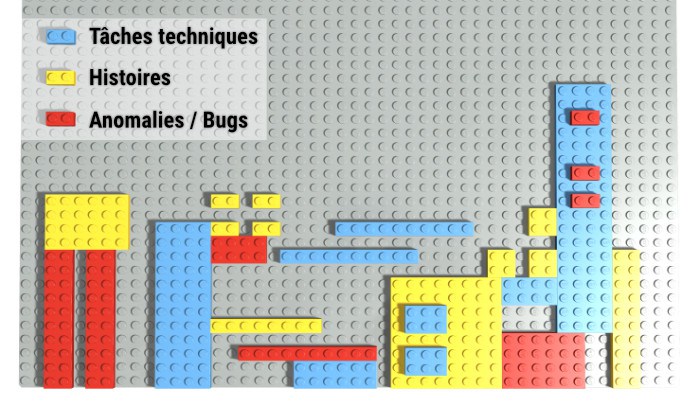 La dette s’accumule
The size of the baseplate can be used as the limit for the debt. You remove the items that are reimbursed.
Tips: a technical task or bug can cover another element, to show a dependency.
Jenga© is a construction game. Here, a brick would be added for each debt element, whatever size it is. The advantage is that the construction becomes quickly unstable because of its height.
 La brique de trop … ?
As an unstoppable metaphor for the state of the product, the tower will begin to wobble and may even collapse in full Sprint when a member of the team adds a brick. You stack the debt which at the beginning is fairly stable and controlled, with no consequences. You can remove items (bricks) from the top of the tower when an item is reimbursed.
The stress guy© : A simple manner to show the debt is to stack small parts of sticky-notes (if possible, the color matches the type of debt) on a dedicated and sized place, that you have printed on a large paper. You can remove items when they are reimbursed.
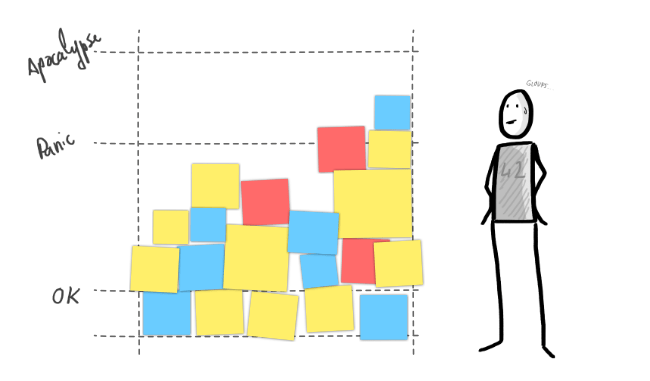 On peut y ajouter un peu de gribouillage …
Prioritization of the debt in the backlog
Whether one estimates in story points or not, each debt’s task must have its business value to be prioritized.
Conclusion
There are really lots of possibilities to visualize the debt in all transparency. Feel free to share your ideas.Did I miss something? I’d really liked to know your though about this.


